Building a front-end dashboard for real-time data.
Project description.
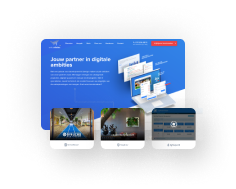
BG-Engineering supplies hardware and software to, among others, Rijkswaterstaat (the executive agency of the Ministry of Infrastructure and Water Management in the Netherlands), in which they can keep track of how the spreader has driven and how much salt has been sprinkled in winter. This can be kept very accurately via GPS systems. By means of their reports and dashboard it gives you direct insight into the salt stocks, breakdowns, repairs and the financial situation. The development of a completely new dashboard was underway, with the design and construction of the front end being outsourced. The Werkkamer had given me the assignment to take care of the design and technical realisation of the front-end of the application.
Development.
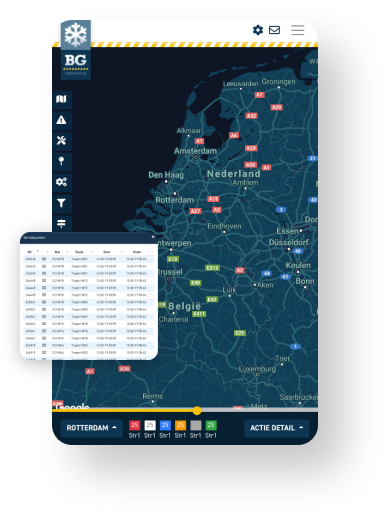
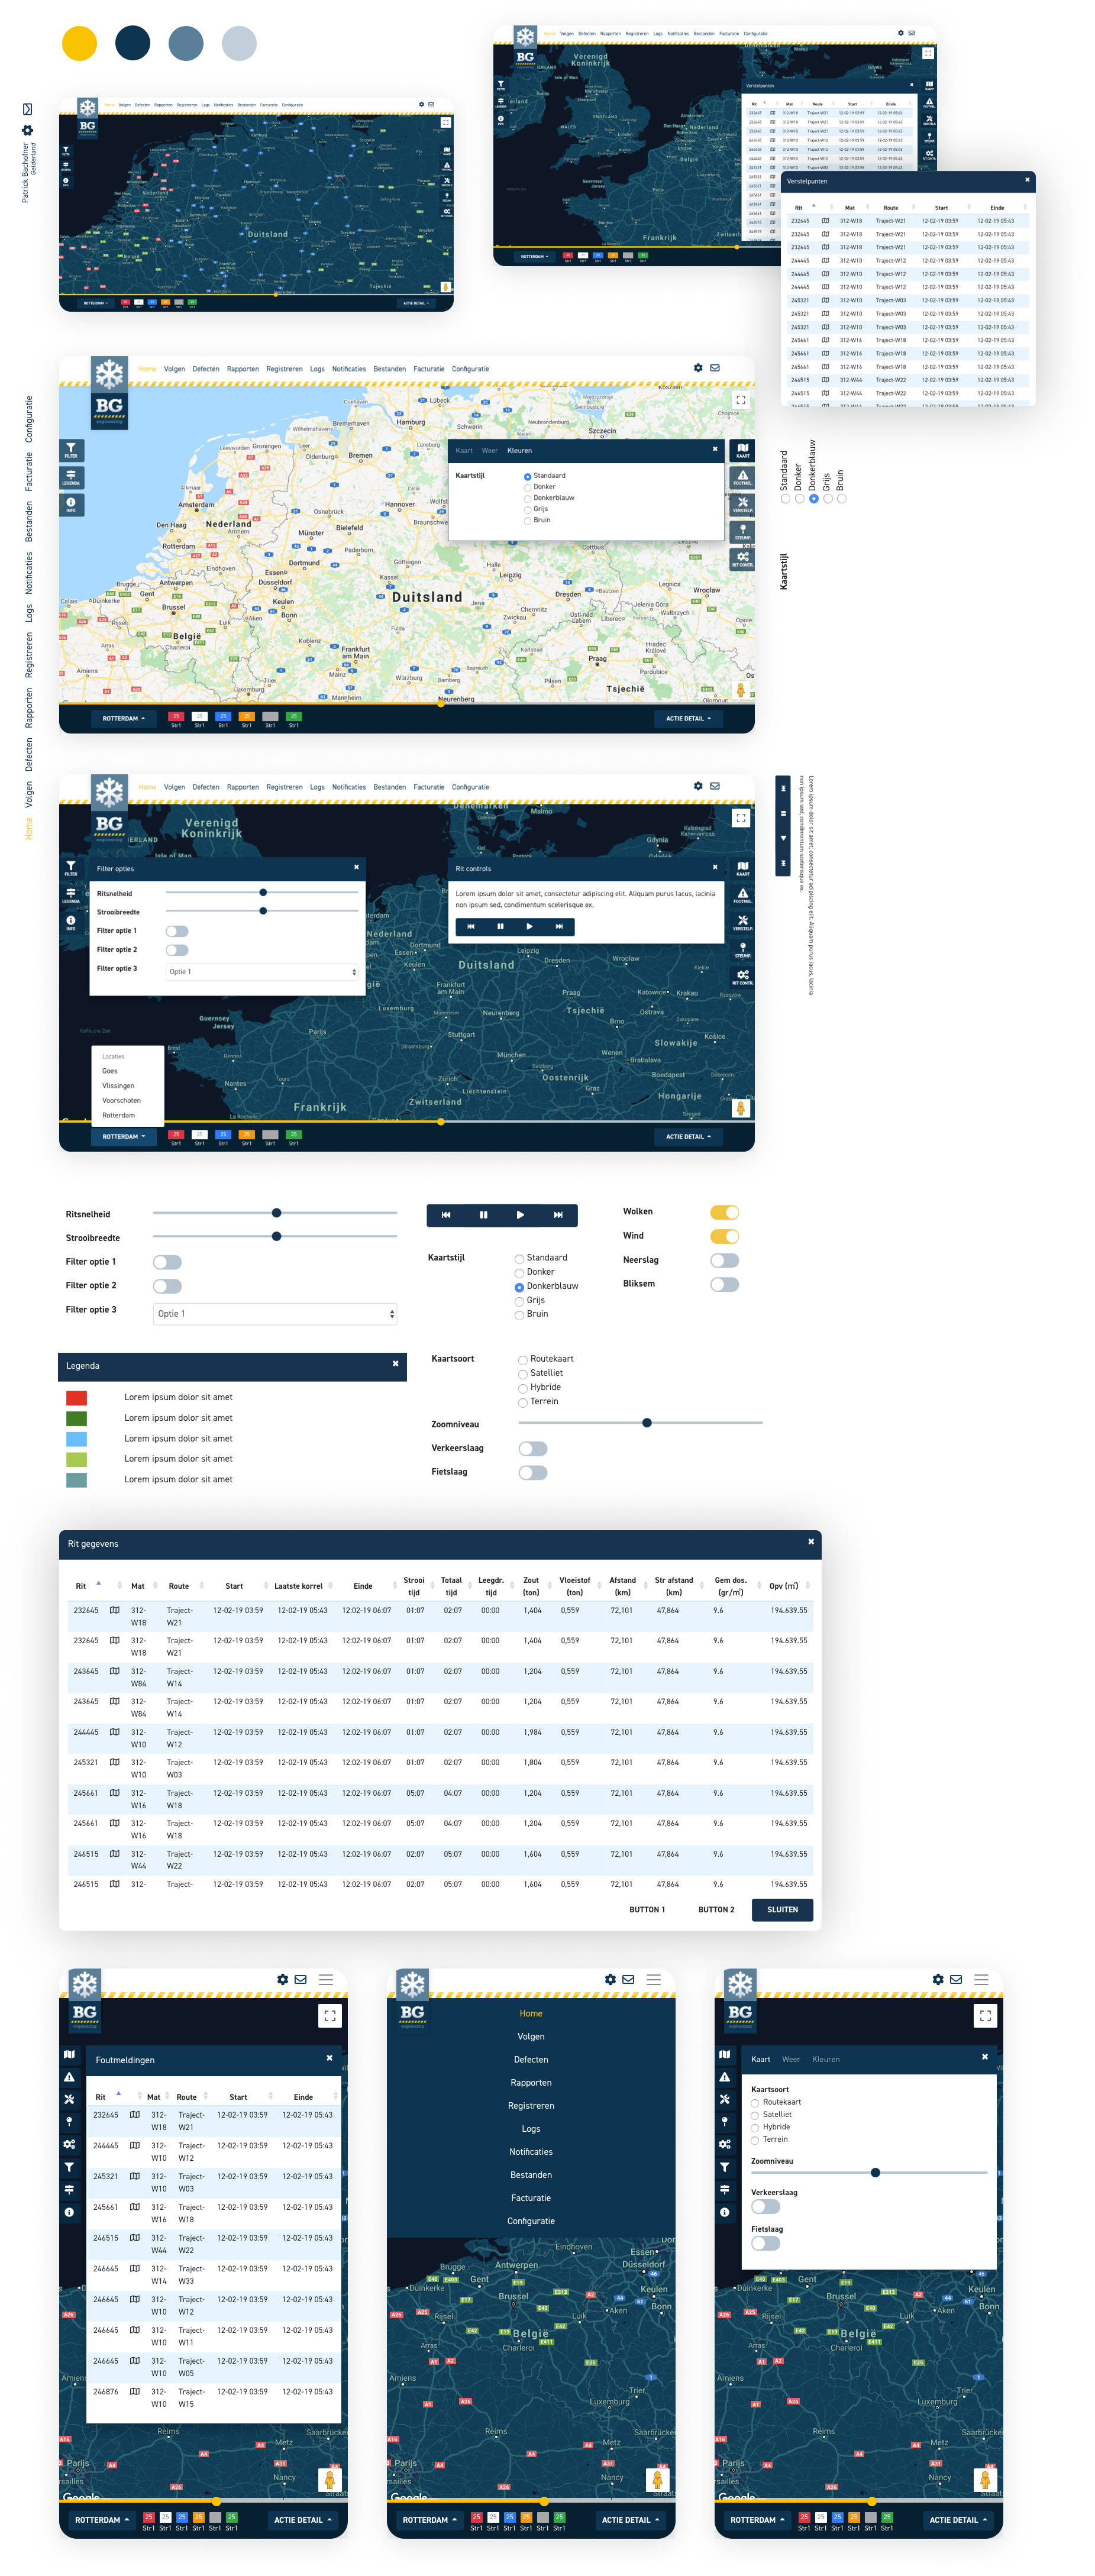
Based on wireframes and guidelines, the design for this project was developed immediately during development with Bootstrap built at a rapid pace based on the brand style guide of BG-Engineering. The Google Maps API library is used for real-time tracking of how gritters have driven and how much salt has been spread. For some technical specifications, some Javascript functionalities have been built in during the front-end phase with which you can manipulate the map, layers and view using certain filters.
To the left and right of the screen, sidebar menus have been developed with fold-out tabs in which configurations and tables have been placed to configure the dashboard, including spreading action error messages, adjustment points, ride playback controls and filter options. A scrolling playback bar has been developed under the map that allows the user to ‘scroll’ somewhere in the timeline to see, for example, where the spreading action went wrong. Below that, the spreaders are indicated in small blocks with colors that indicate the status of the spreader. In addition, there are two fold-out buttons on the right and left with which you can switch locations and open a table to see the details of the ride data.
Optimizations.
During development, all script libraries are managed via Node.JS/NPM, so that the latest version can always be easily deployed (think of Bootstrap, Fontawesome etc.) and task runners are used with Gulp.js to compile all SASS and JavaScript to minified and combined scripts. This ensures that a minimum number of requests is maintained, which greatly benefits the speed. Since the application has been developed responsive and “mobile first”, the application works optimally on every device and can also be viewed for every device and user.
Development tools.
Client reference.

Andrea van der Roest,
Creative director at De Werkkamer
We love to work with Brandon, because he does a very good job in the technical implementation. He delivers custom work, which is why we like to place beautiful custom made designs with him!